Key takeaways
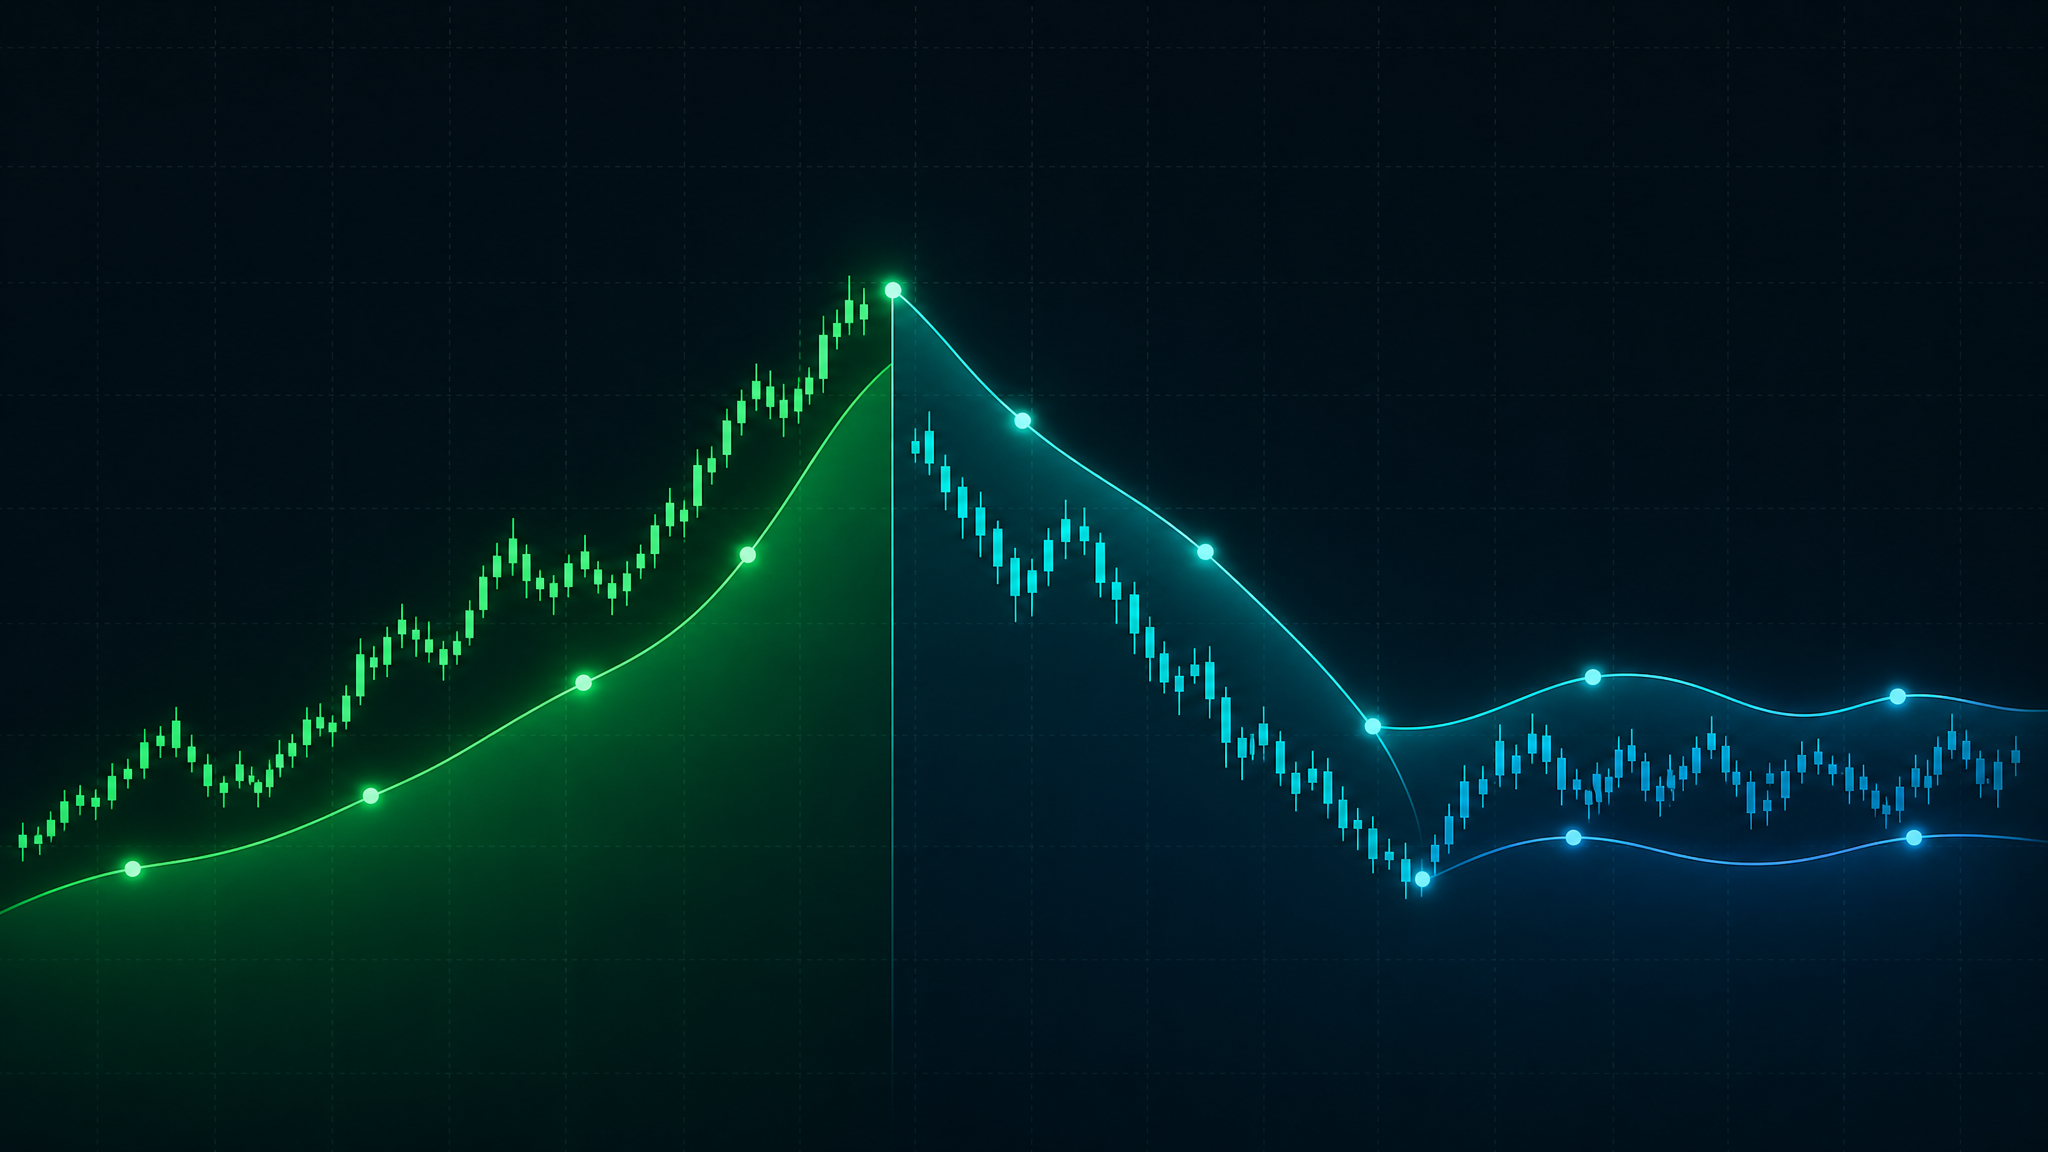
- A regime is the market’s current "mood": trending, ranging, or volatile.
- Strategies that win in one regime often lose in another — fit matters more than cleverness.
- Sentrivest labels regimes deterministically, so the same data always yields the same label.
Most beginners look for a single indicator that "works." Experienced traders look for context first. That context is the market regime — the broad character of price behavior over a window of time. Get the regime right and average strategies perform well. Get it wrong and even a brilliant setup bleeds out.
The three regimes that matter
You do not need dozens of labels. Almost every actionable distinction collapses into three:
- Trending — price makes sustained directional moves; momentum and breakout strategies tend to fit.
- Ranging — price oscillates inside a band; mean-reversion strategies tend to fit while breakout strategies get chopped up.
- Volatile / transitional — expansion in range and noise; position sizes should shrink and conviction should rise before acting.
Why prediction is the wrong goal
Nobody reliably predicts the next candle. But you can accurately describe the environment you are in right now, and you can size and select strategies for that environment. That shift — from forecasting price to classifying context — is what separates disciplined traders from gamblers.
Context is knowable; the future is not. Trade the regime you are in, not the one you hope for.
How Sentrivest labels the regime
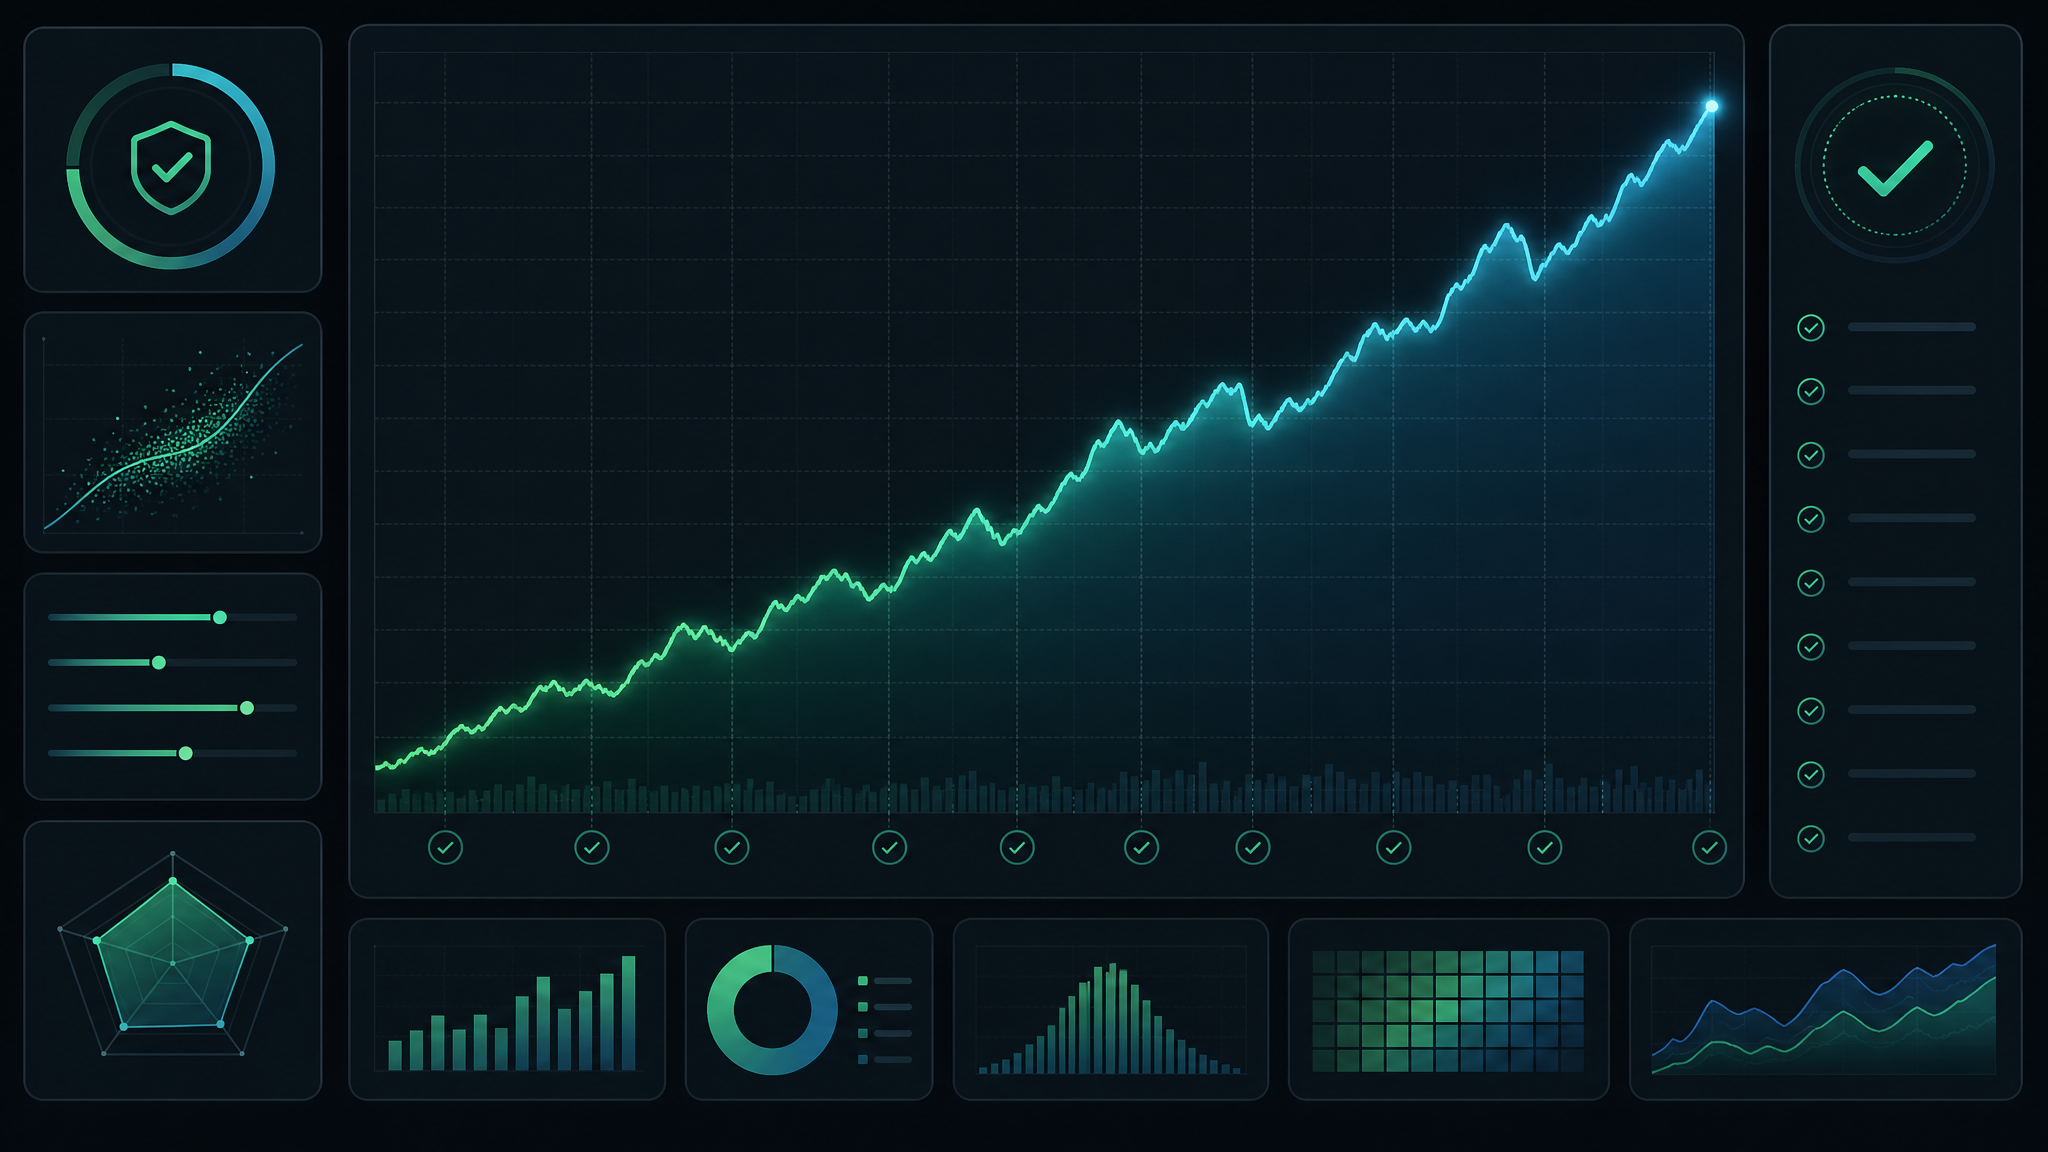
Sentrivest’s regime detection is deterministic: it reads trend strength, volatility, and range structure from real historical data and outputs a labeled history. The same inputs always produce the same labels — there is no hidden randomness and no black box. You can trace exactly why a window was called "trending" versus "ranging," and see how your strategy would have behaved across each stretch.
For education, training and simulation only. Not financial, investment or trading advice. Simulated/paper results do not represent real trading and are not indicative of future results.